Transportation Dashboard
The Commuter Services Transportation Dashboard is an interactive tool that provides transportation data to our stakeholders. The goal of this dashboard is to share more information about how our University community parks, commutes, and how the University uses the revenue from managing these resources. Please click through the below tabs to learn more about permit sales, changes to campus parking, transportation mode statistics, funding and expenditures, our plans/studies, and more.
Parking and Permits
Parking
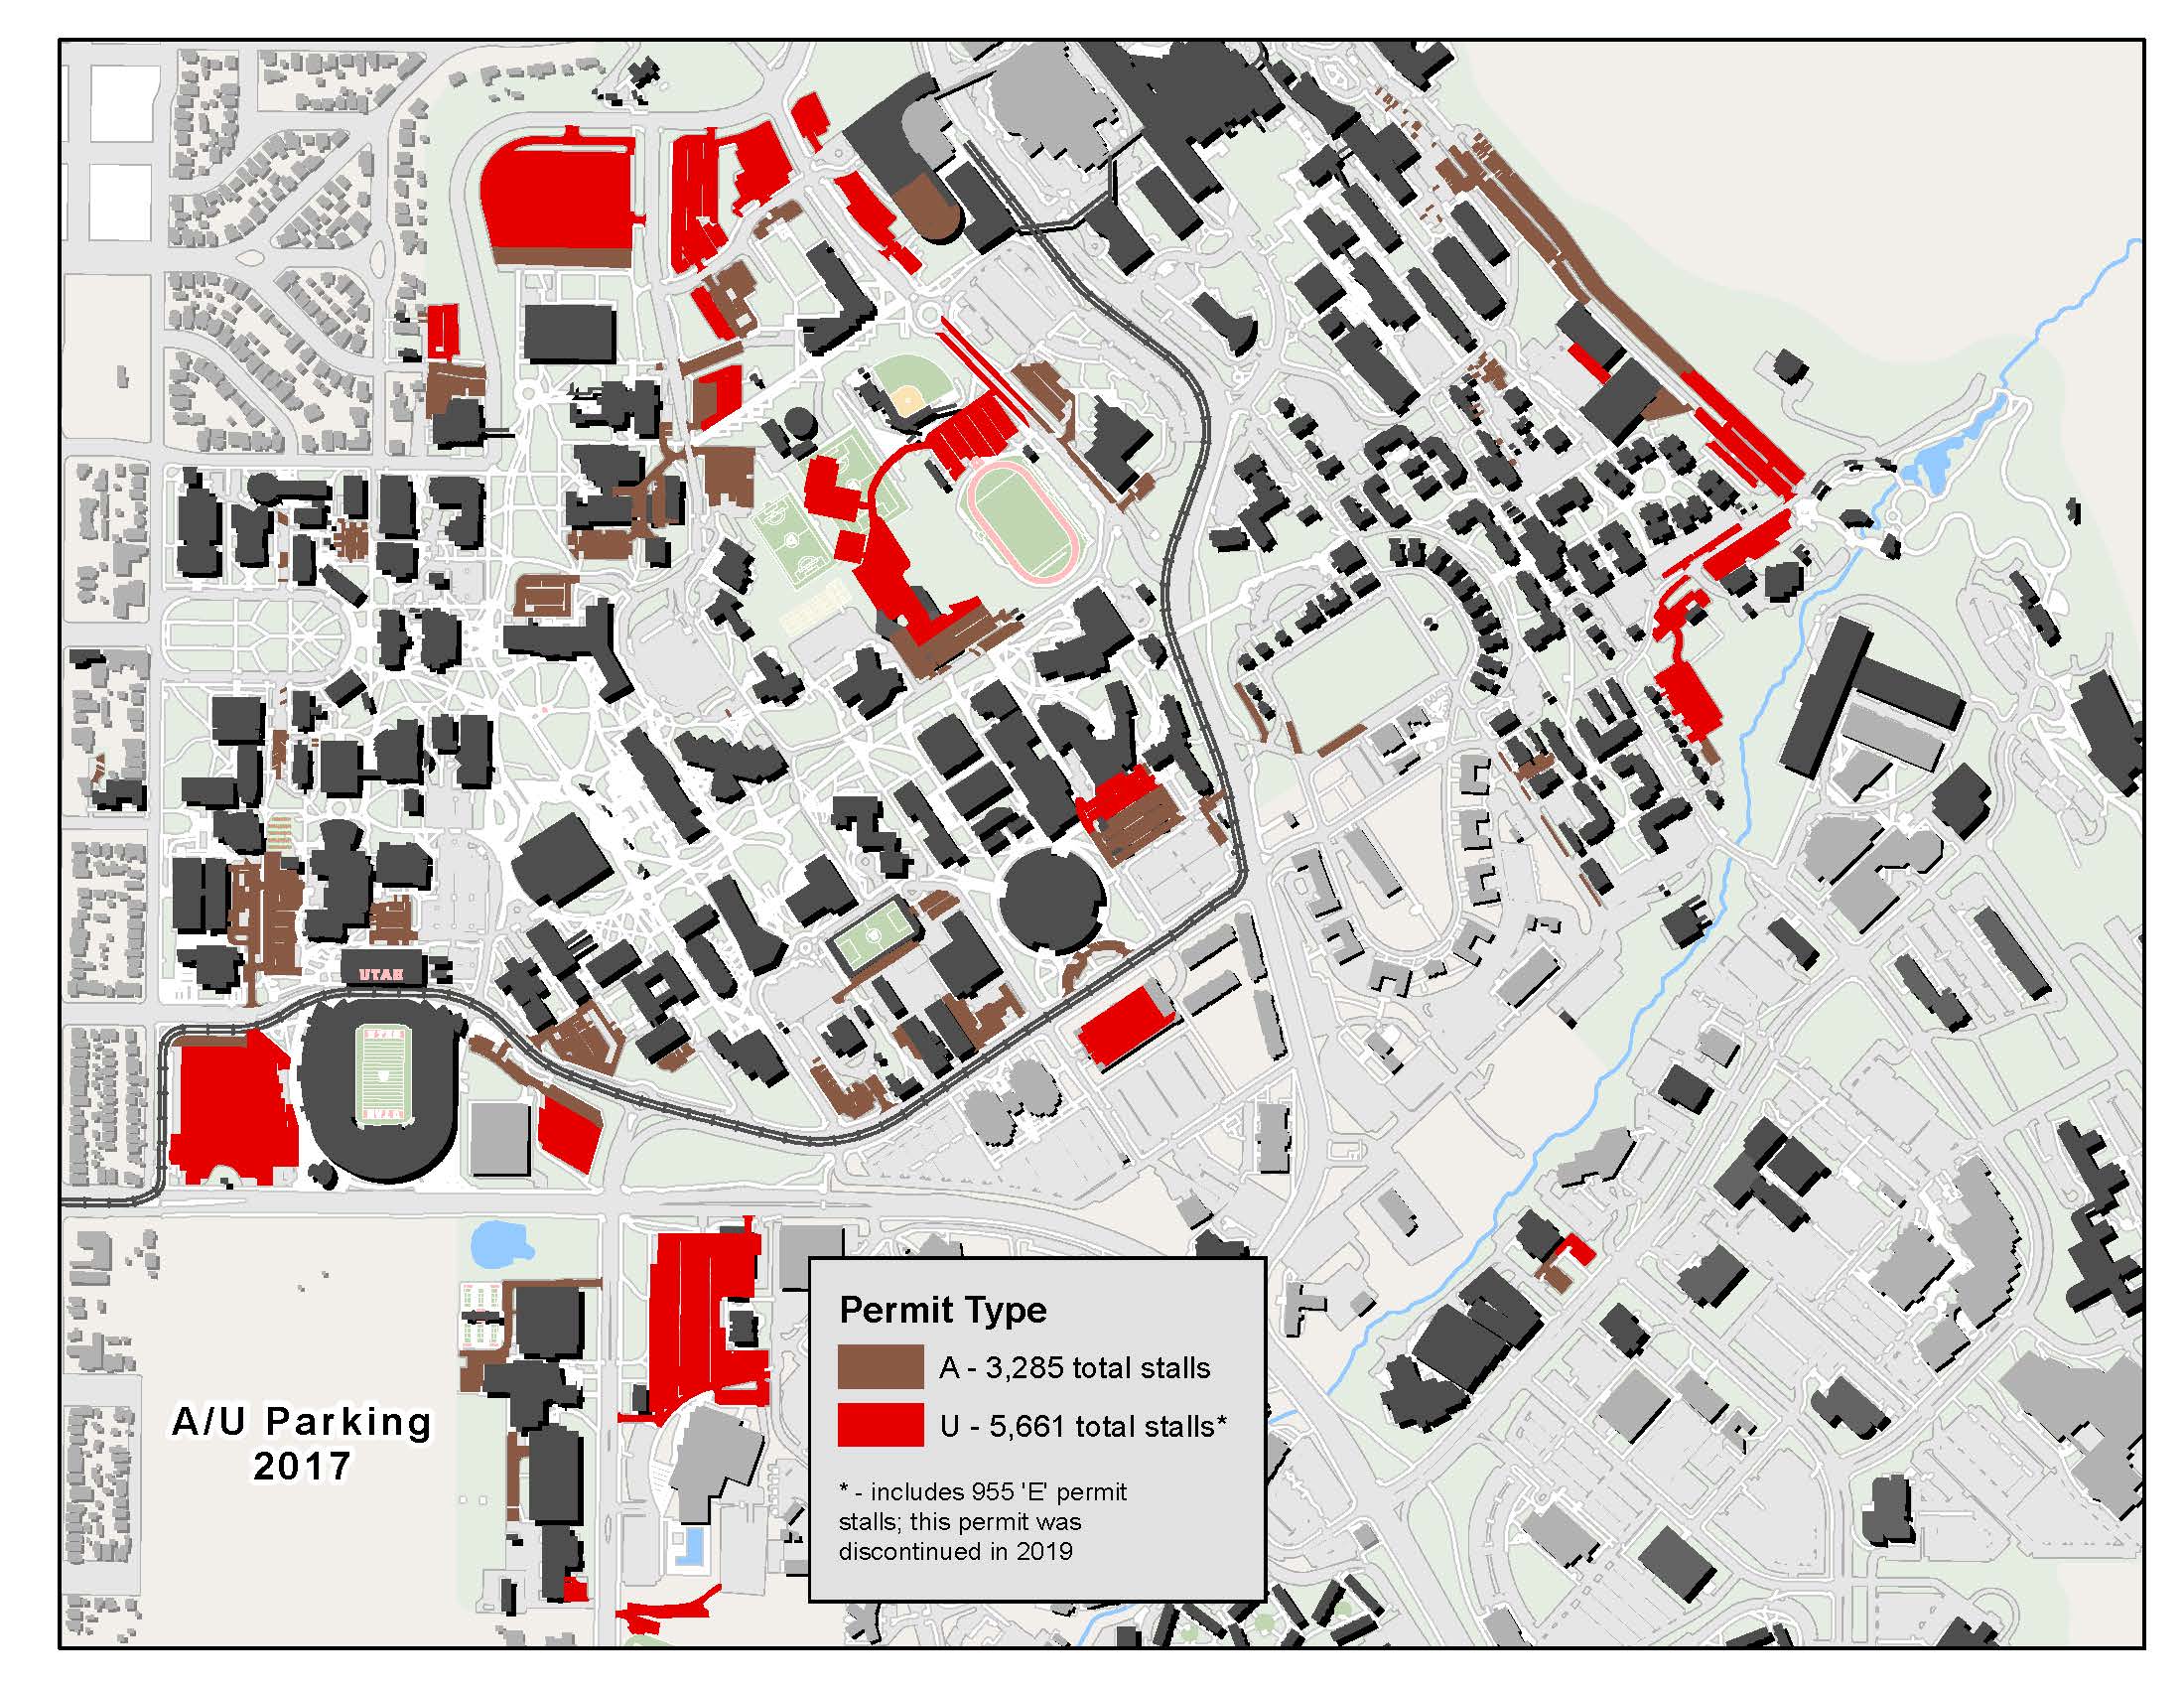
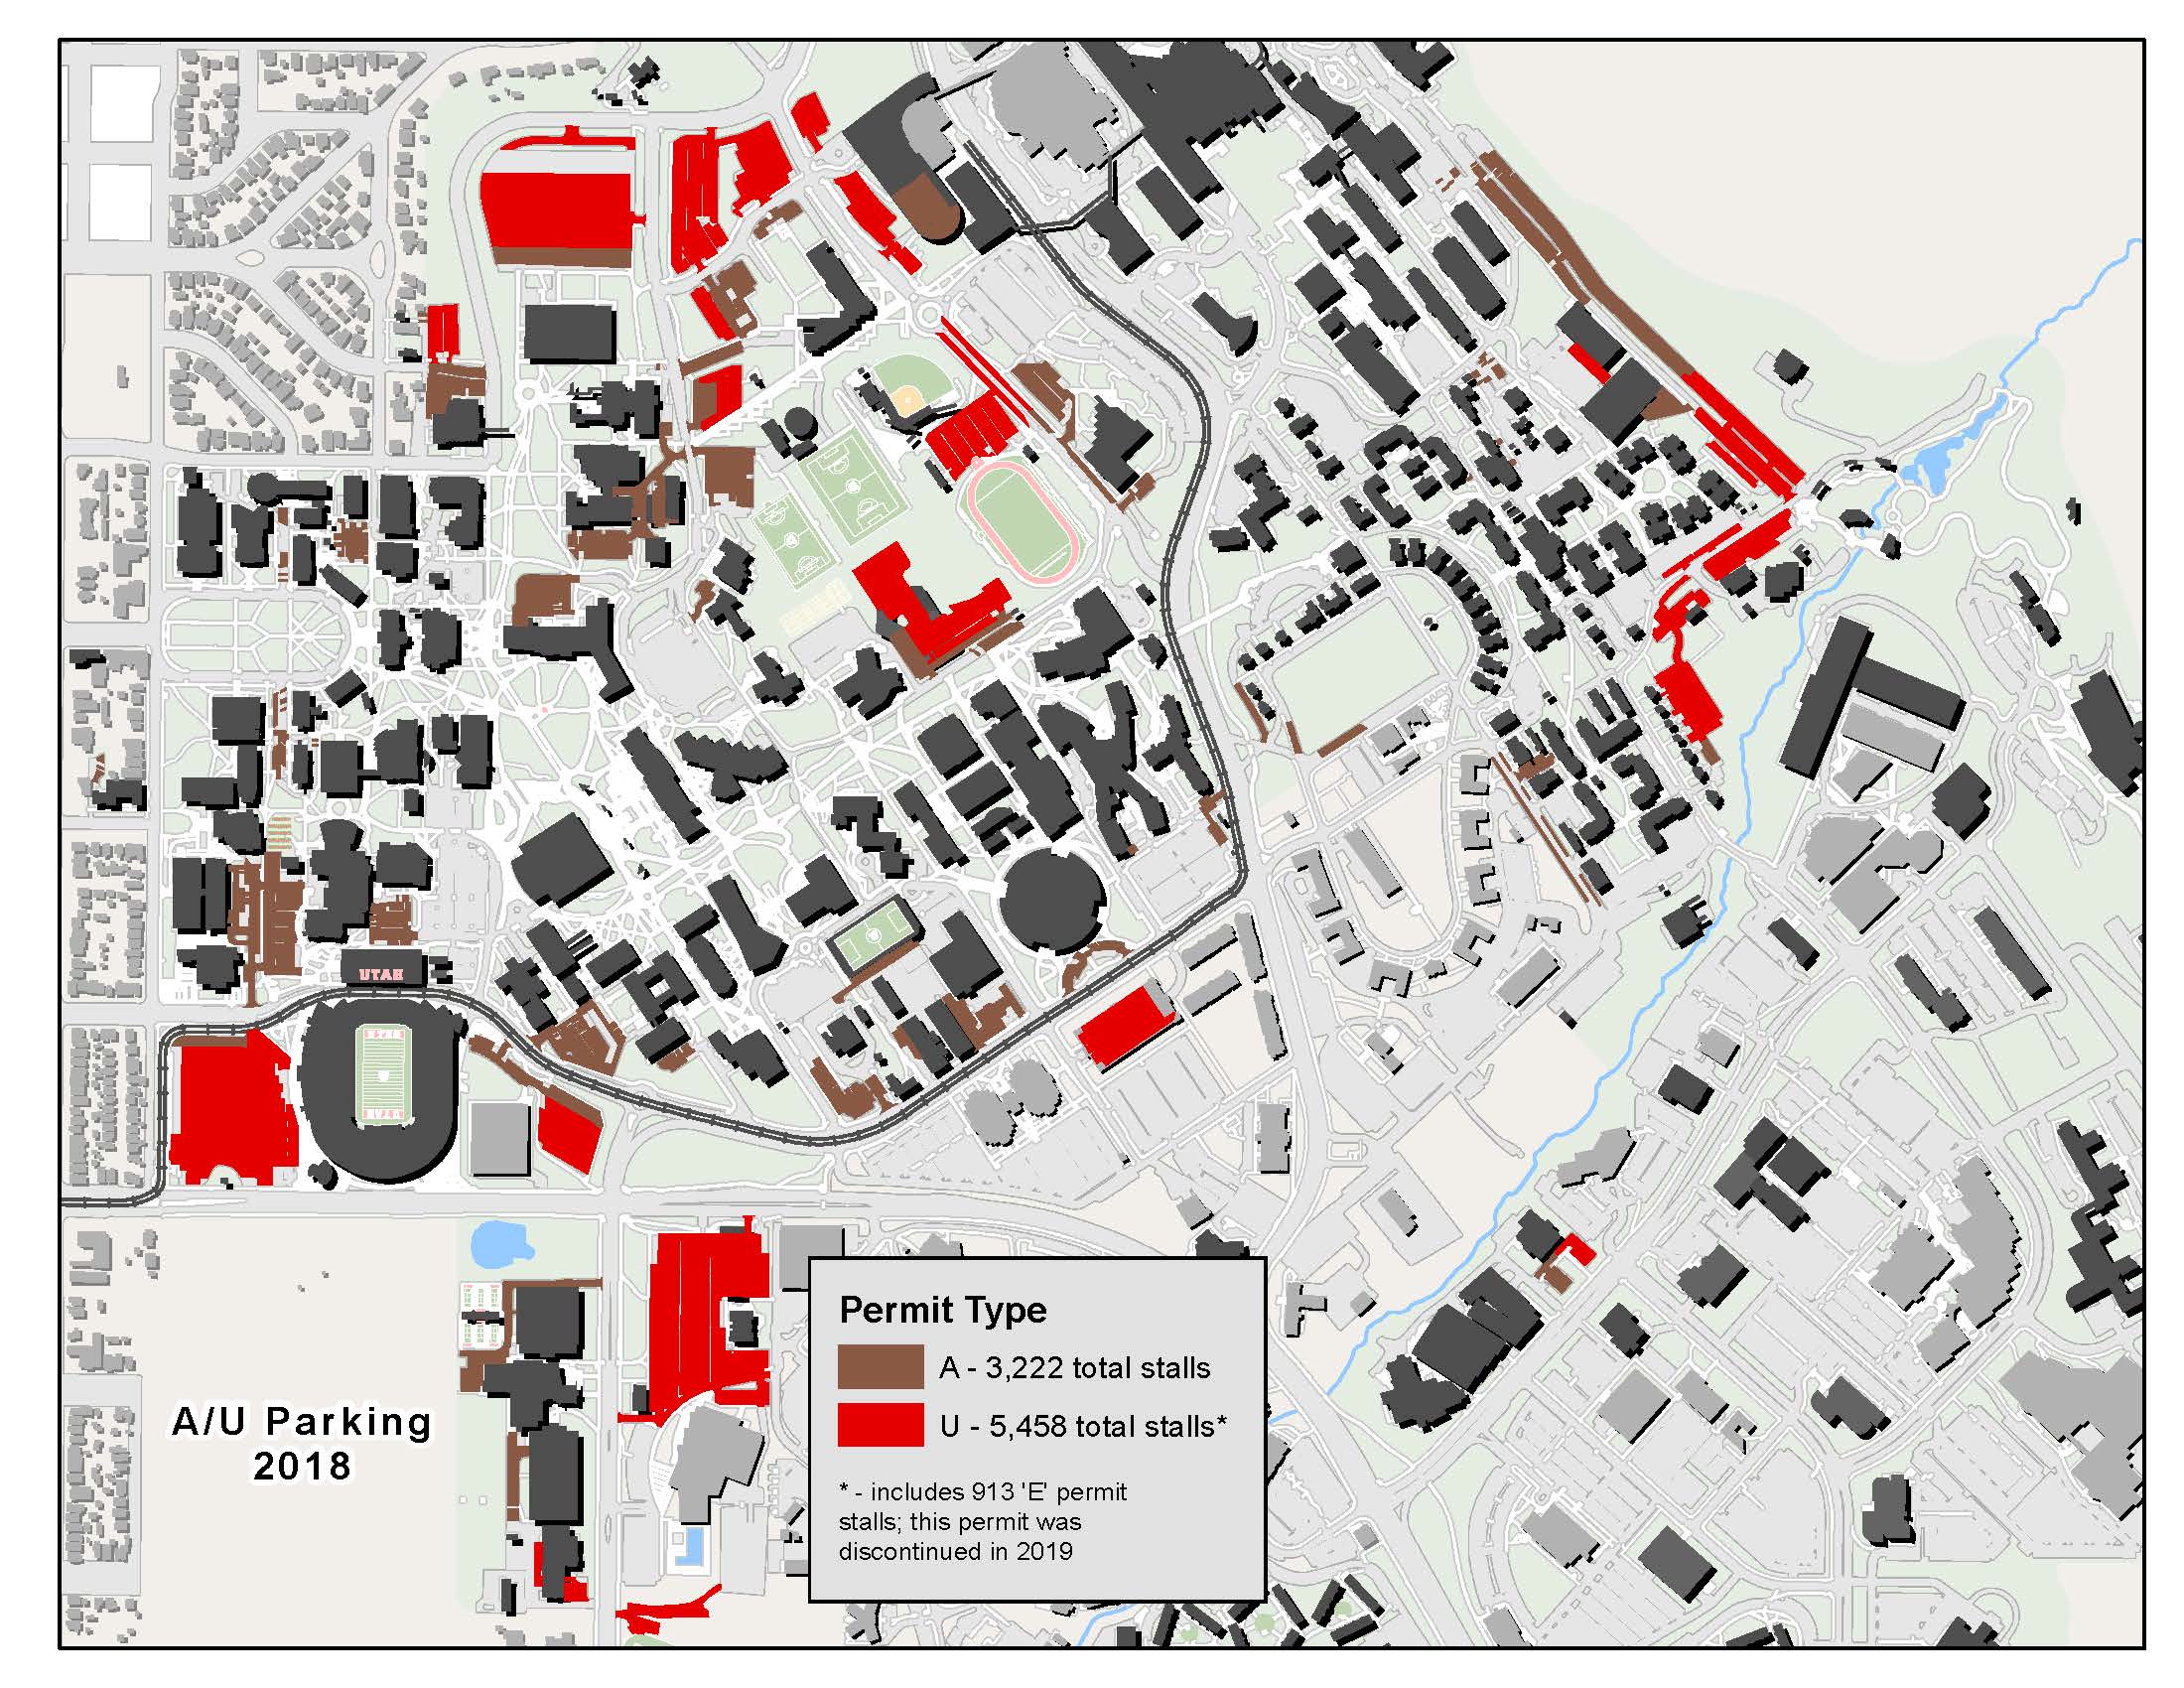
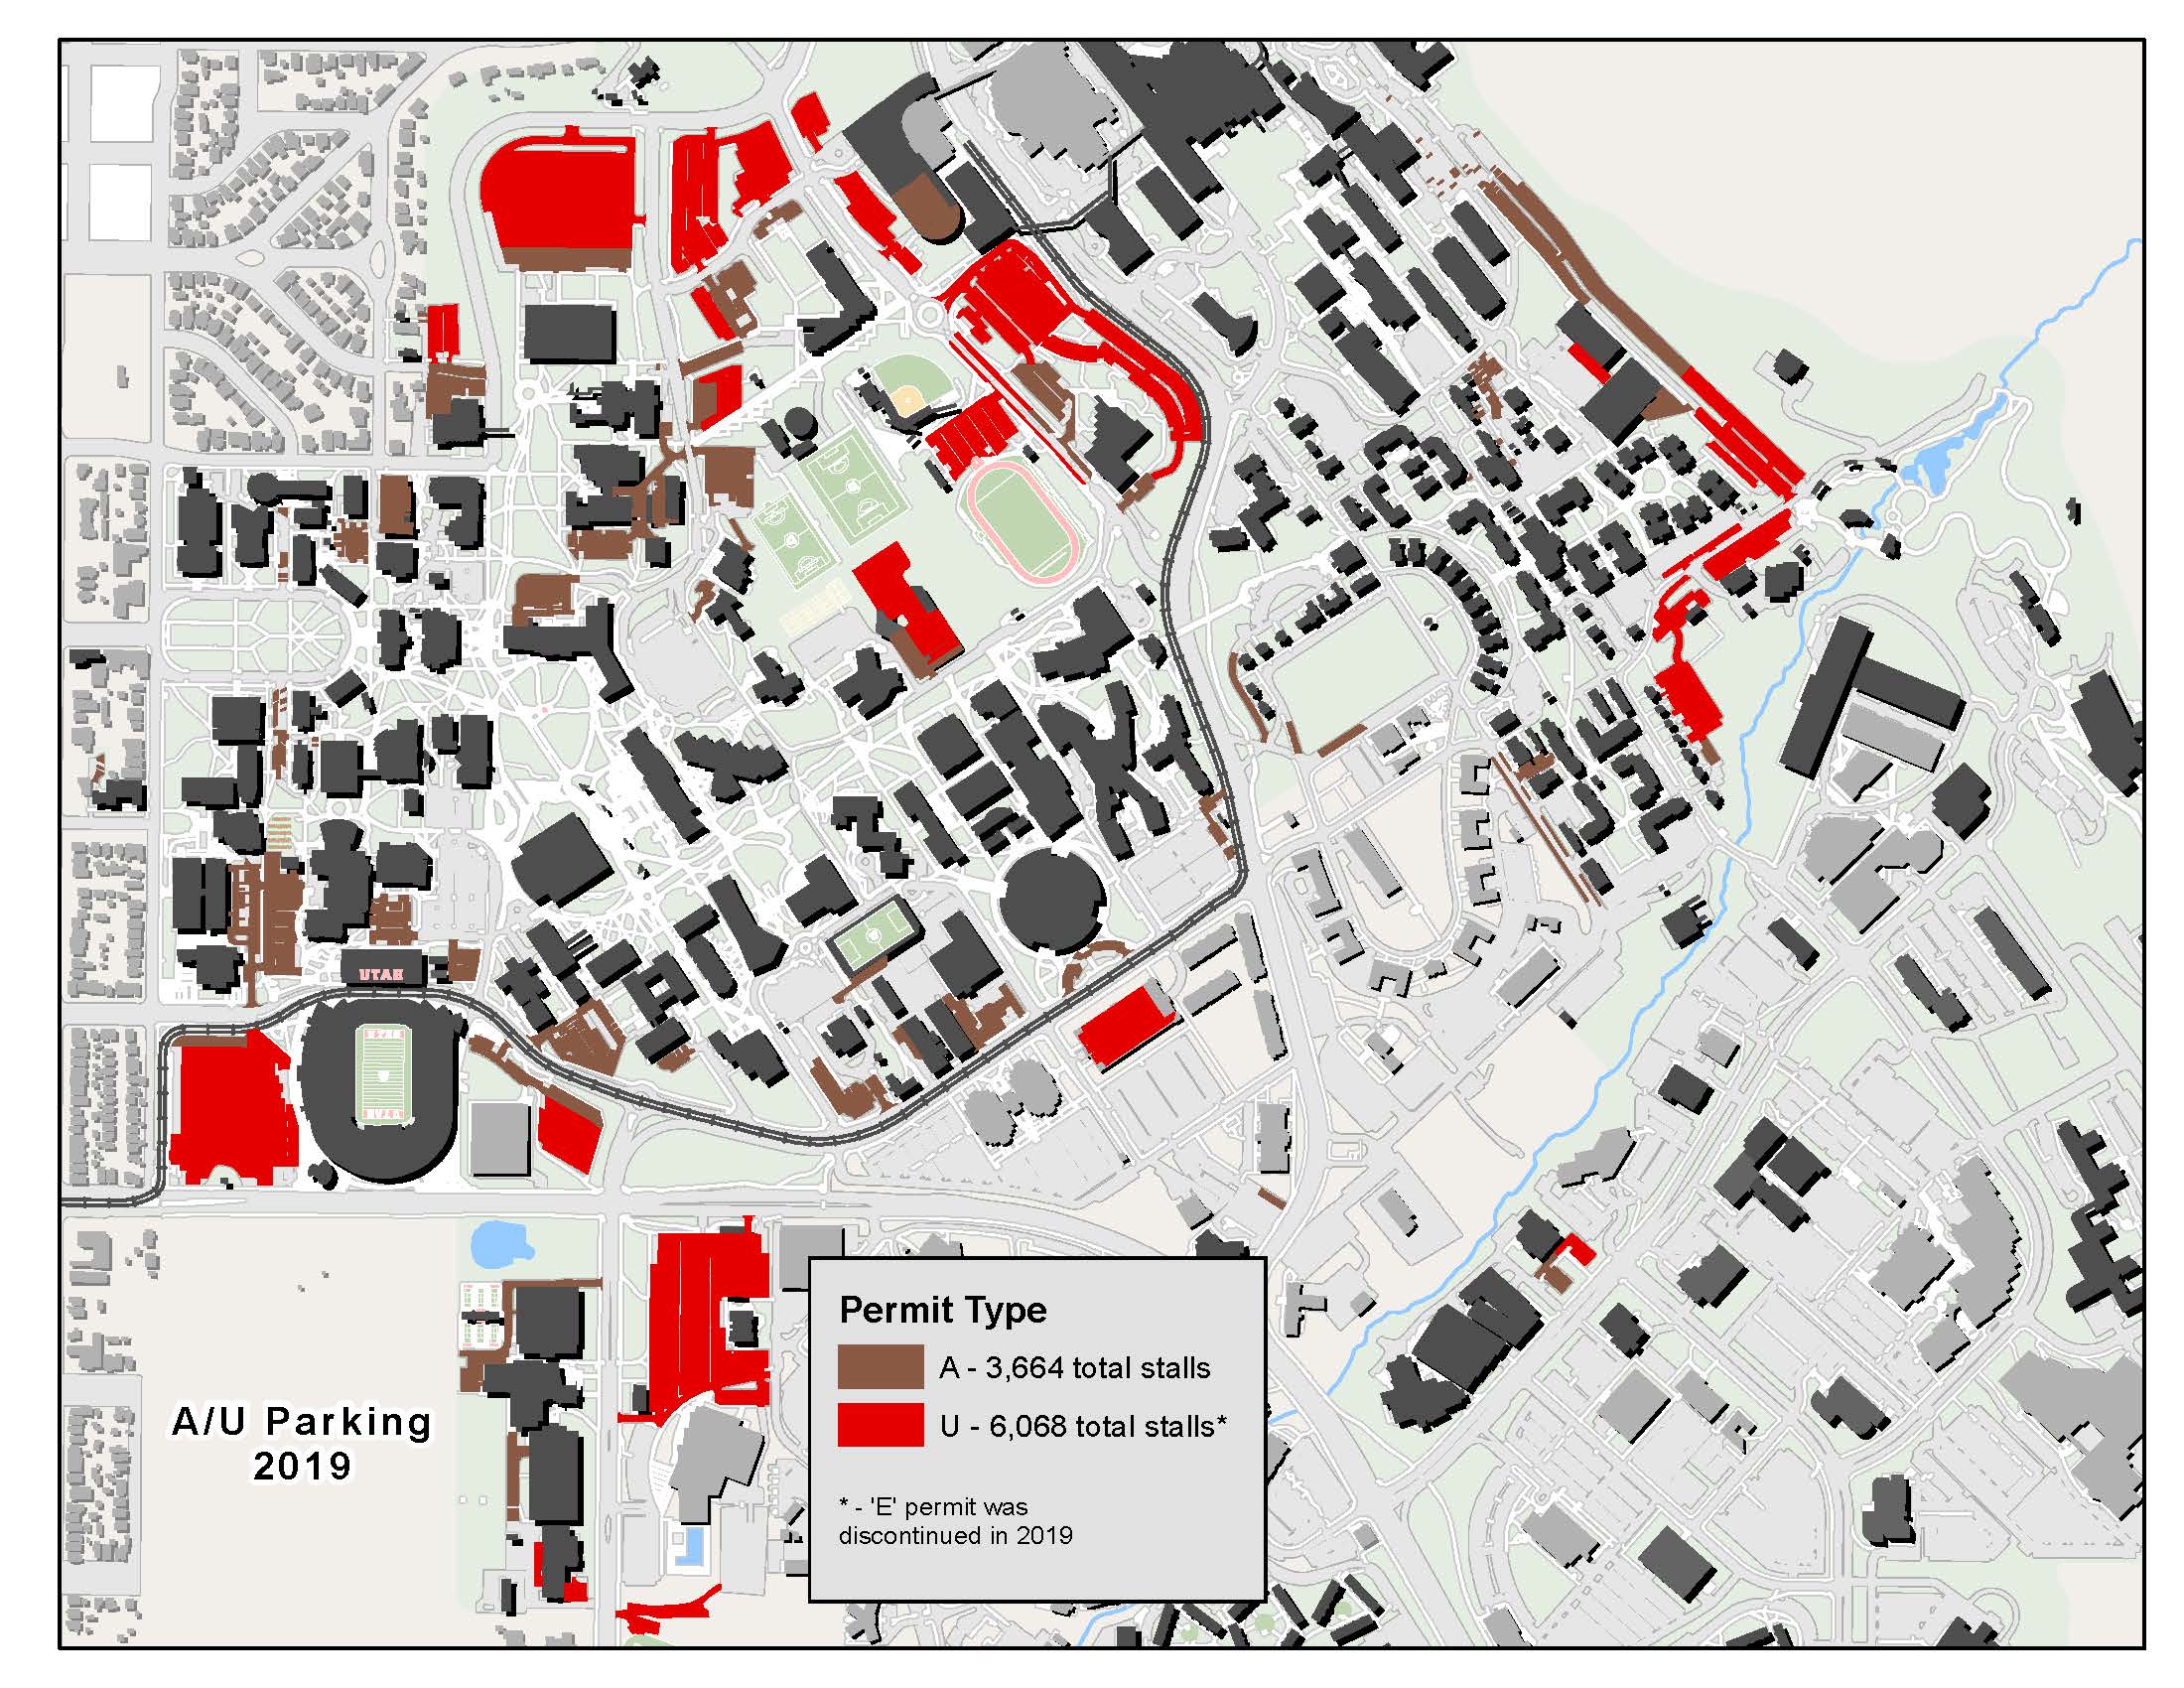
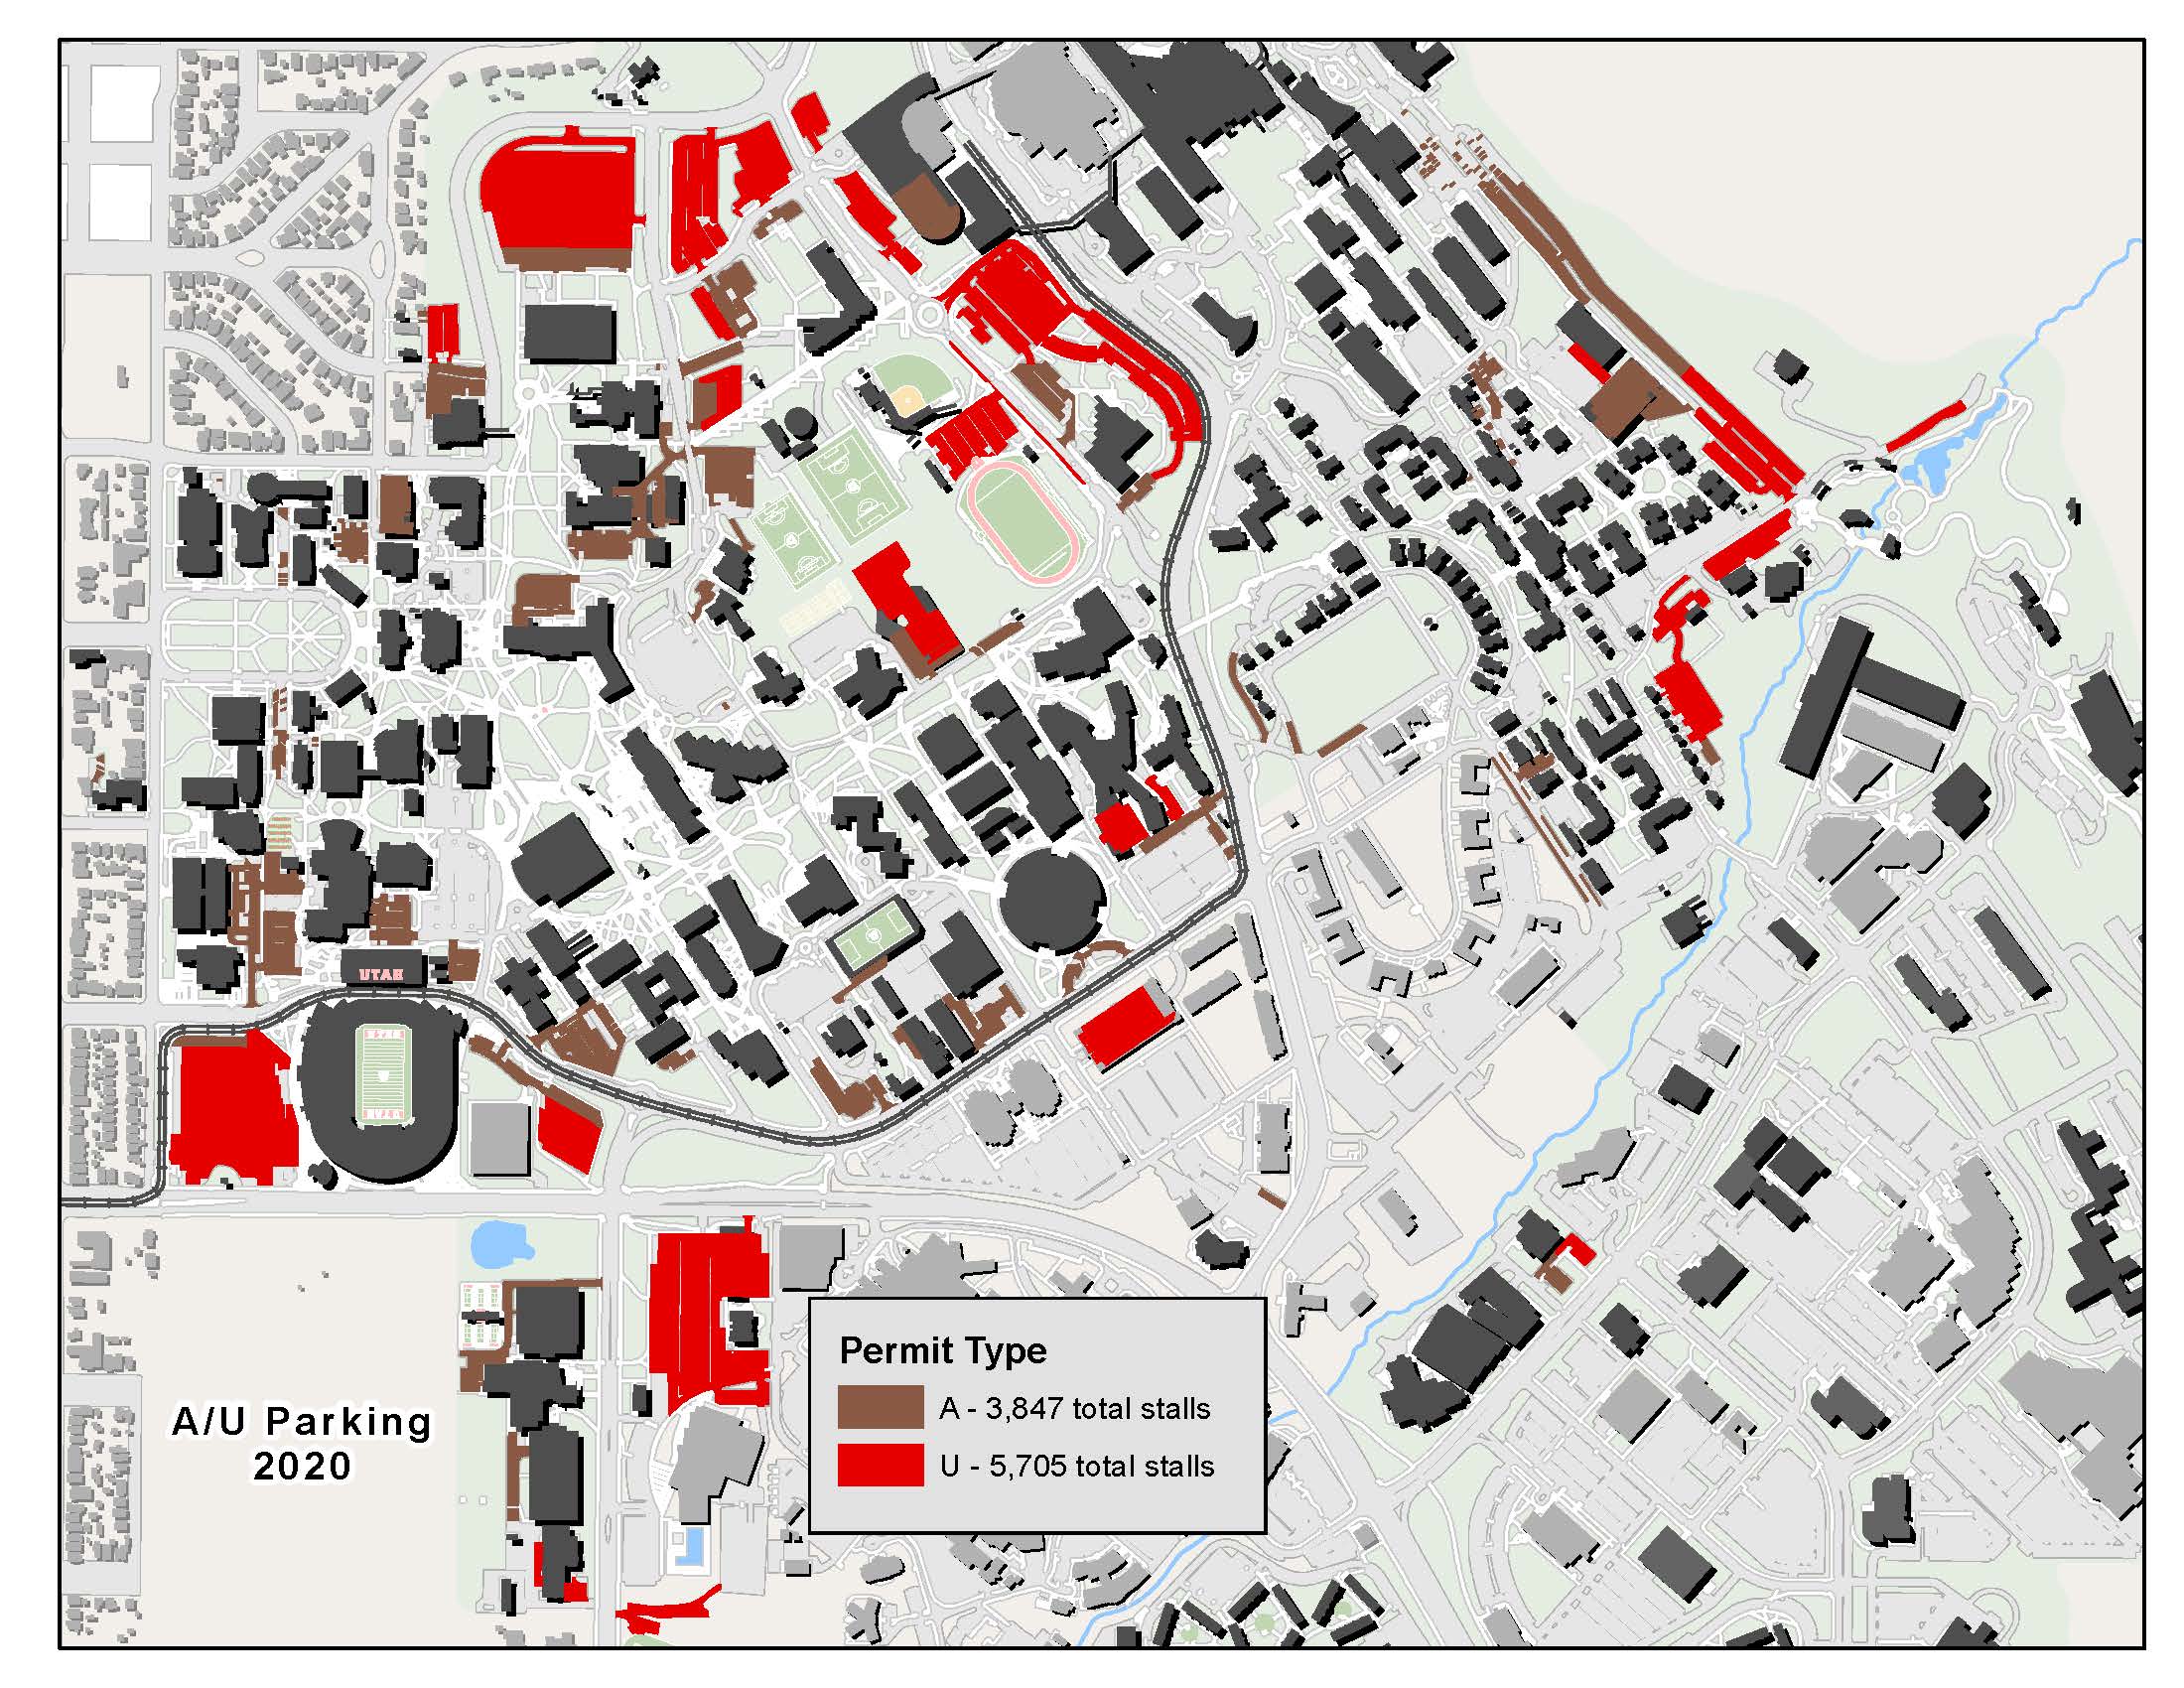

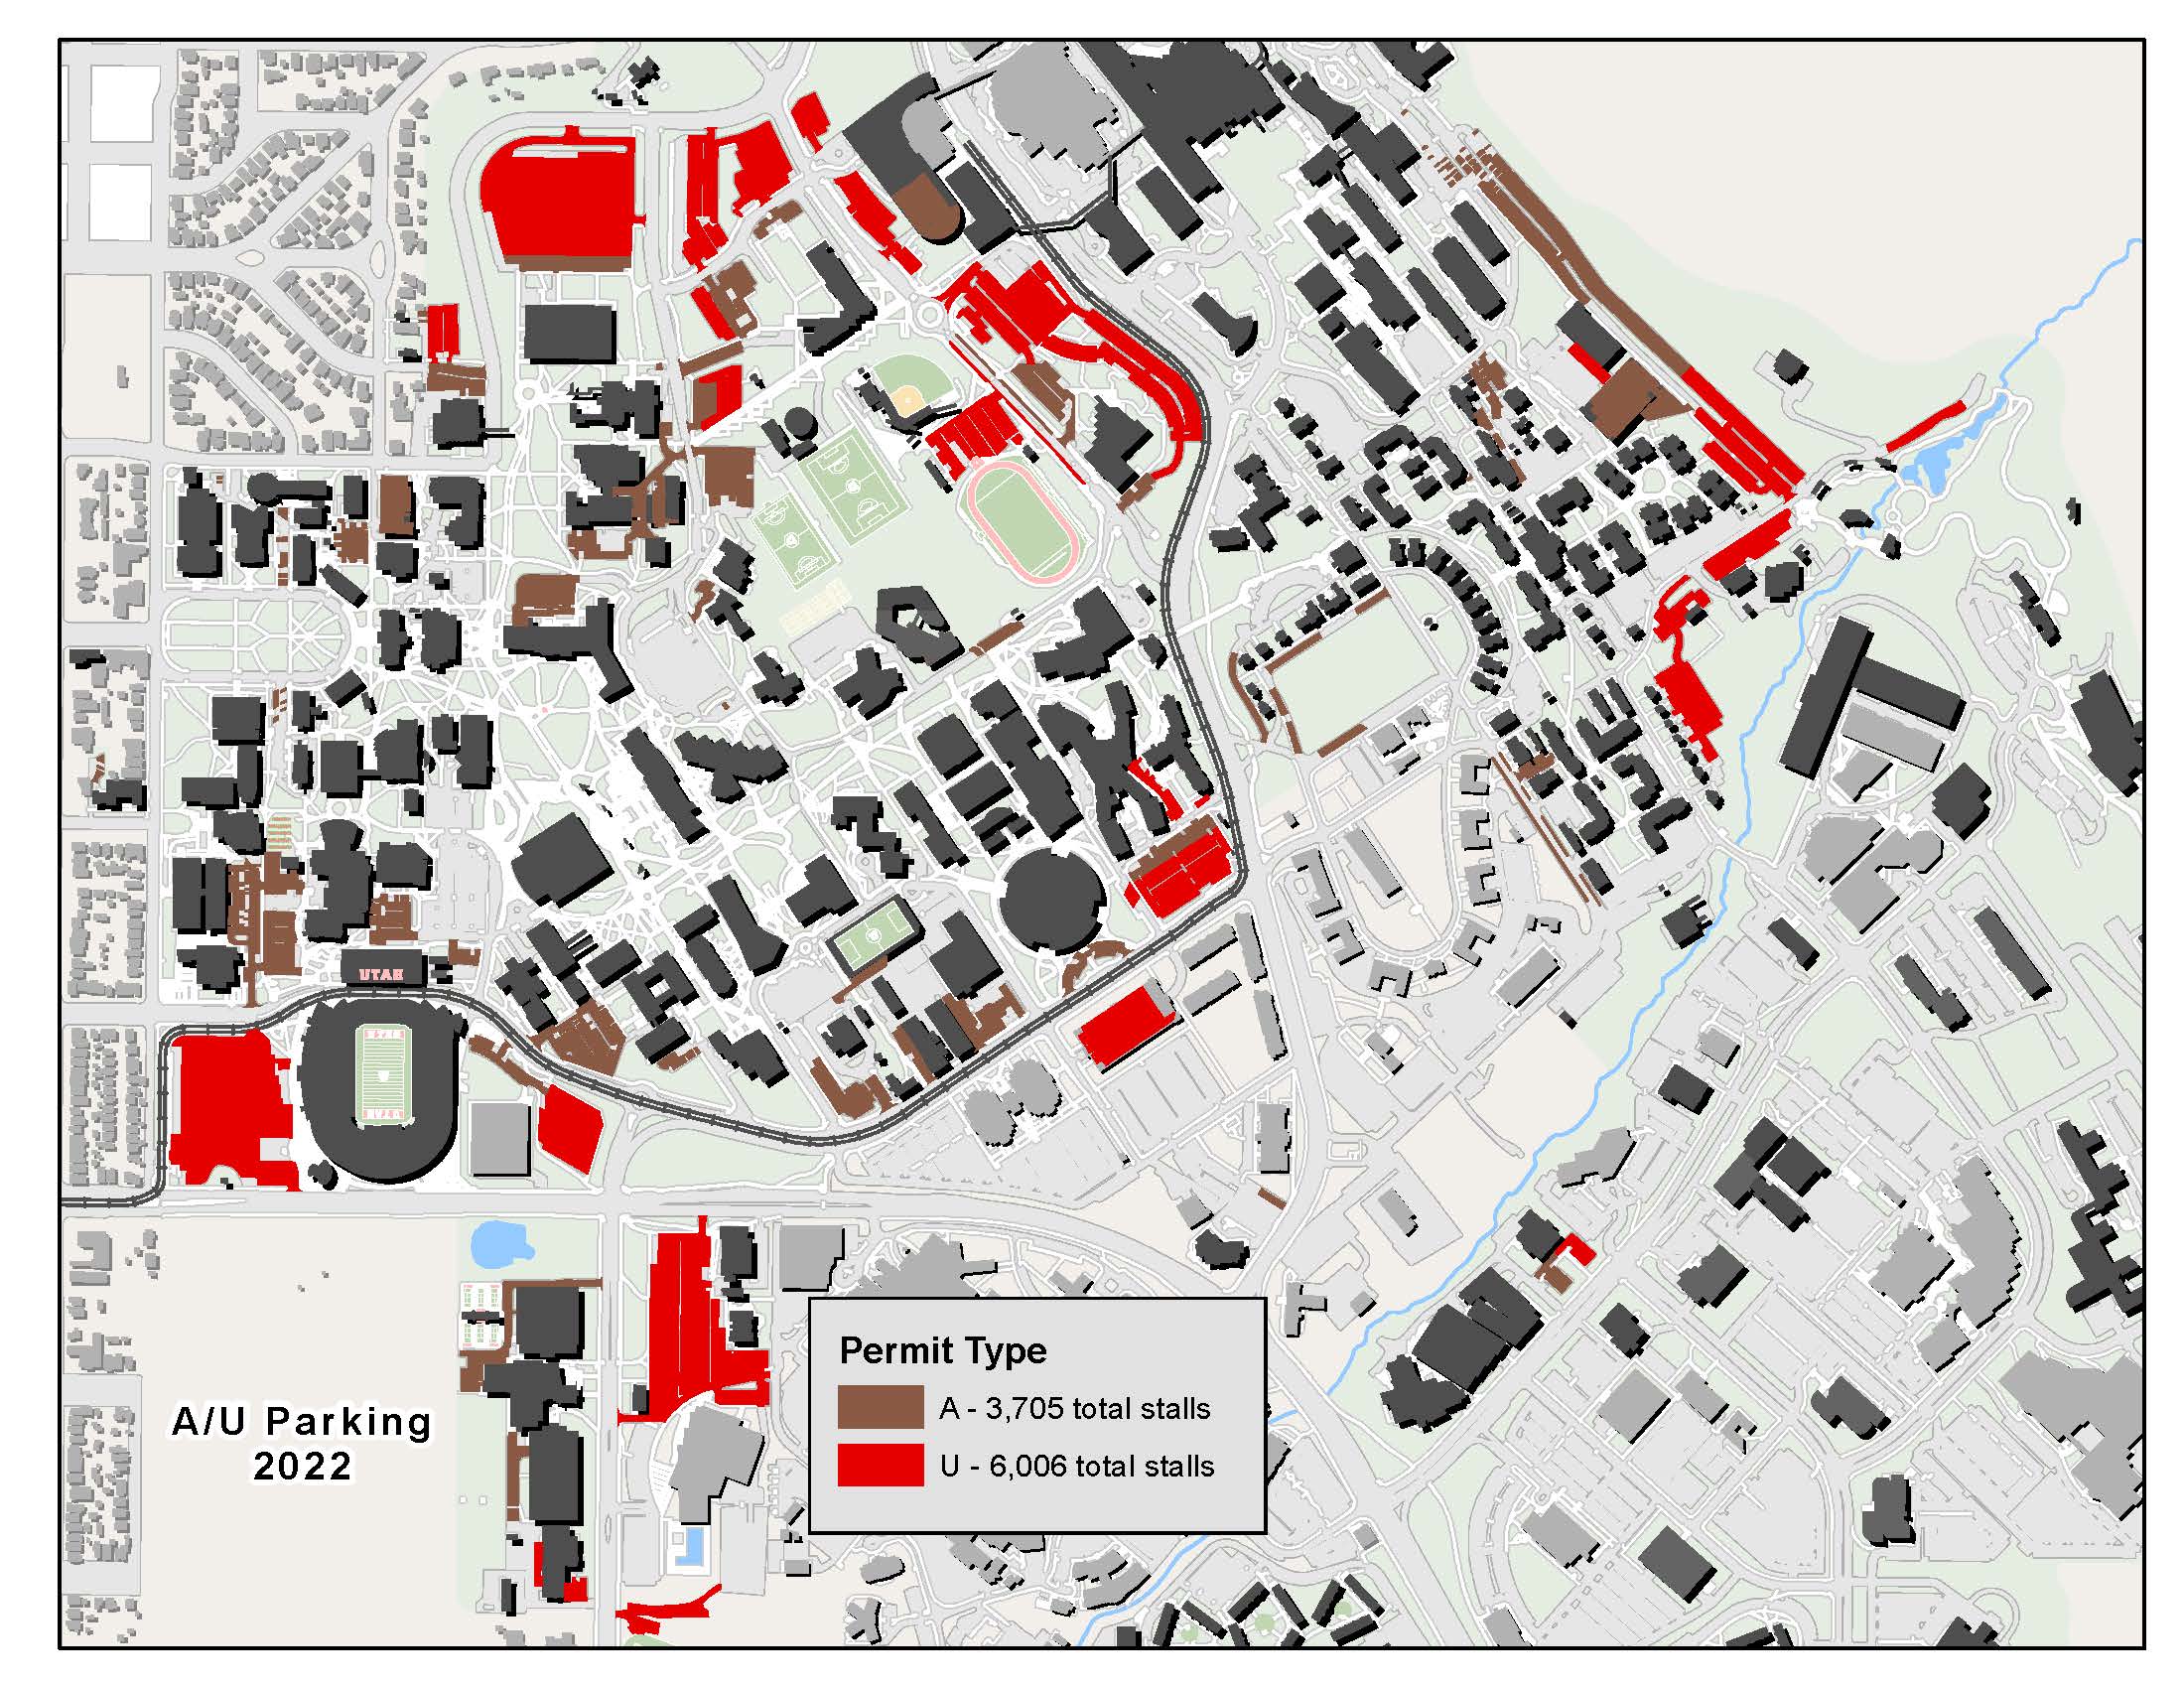
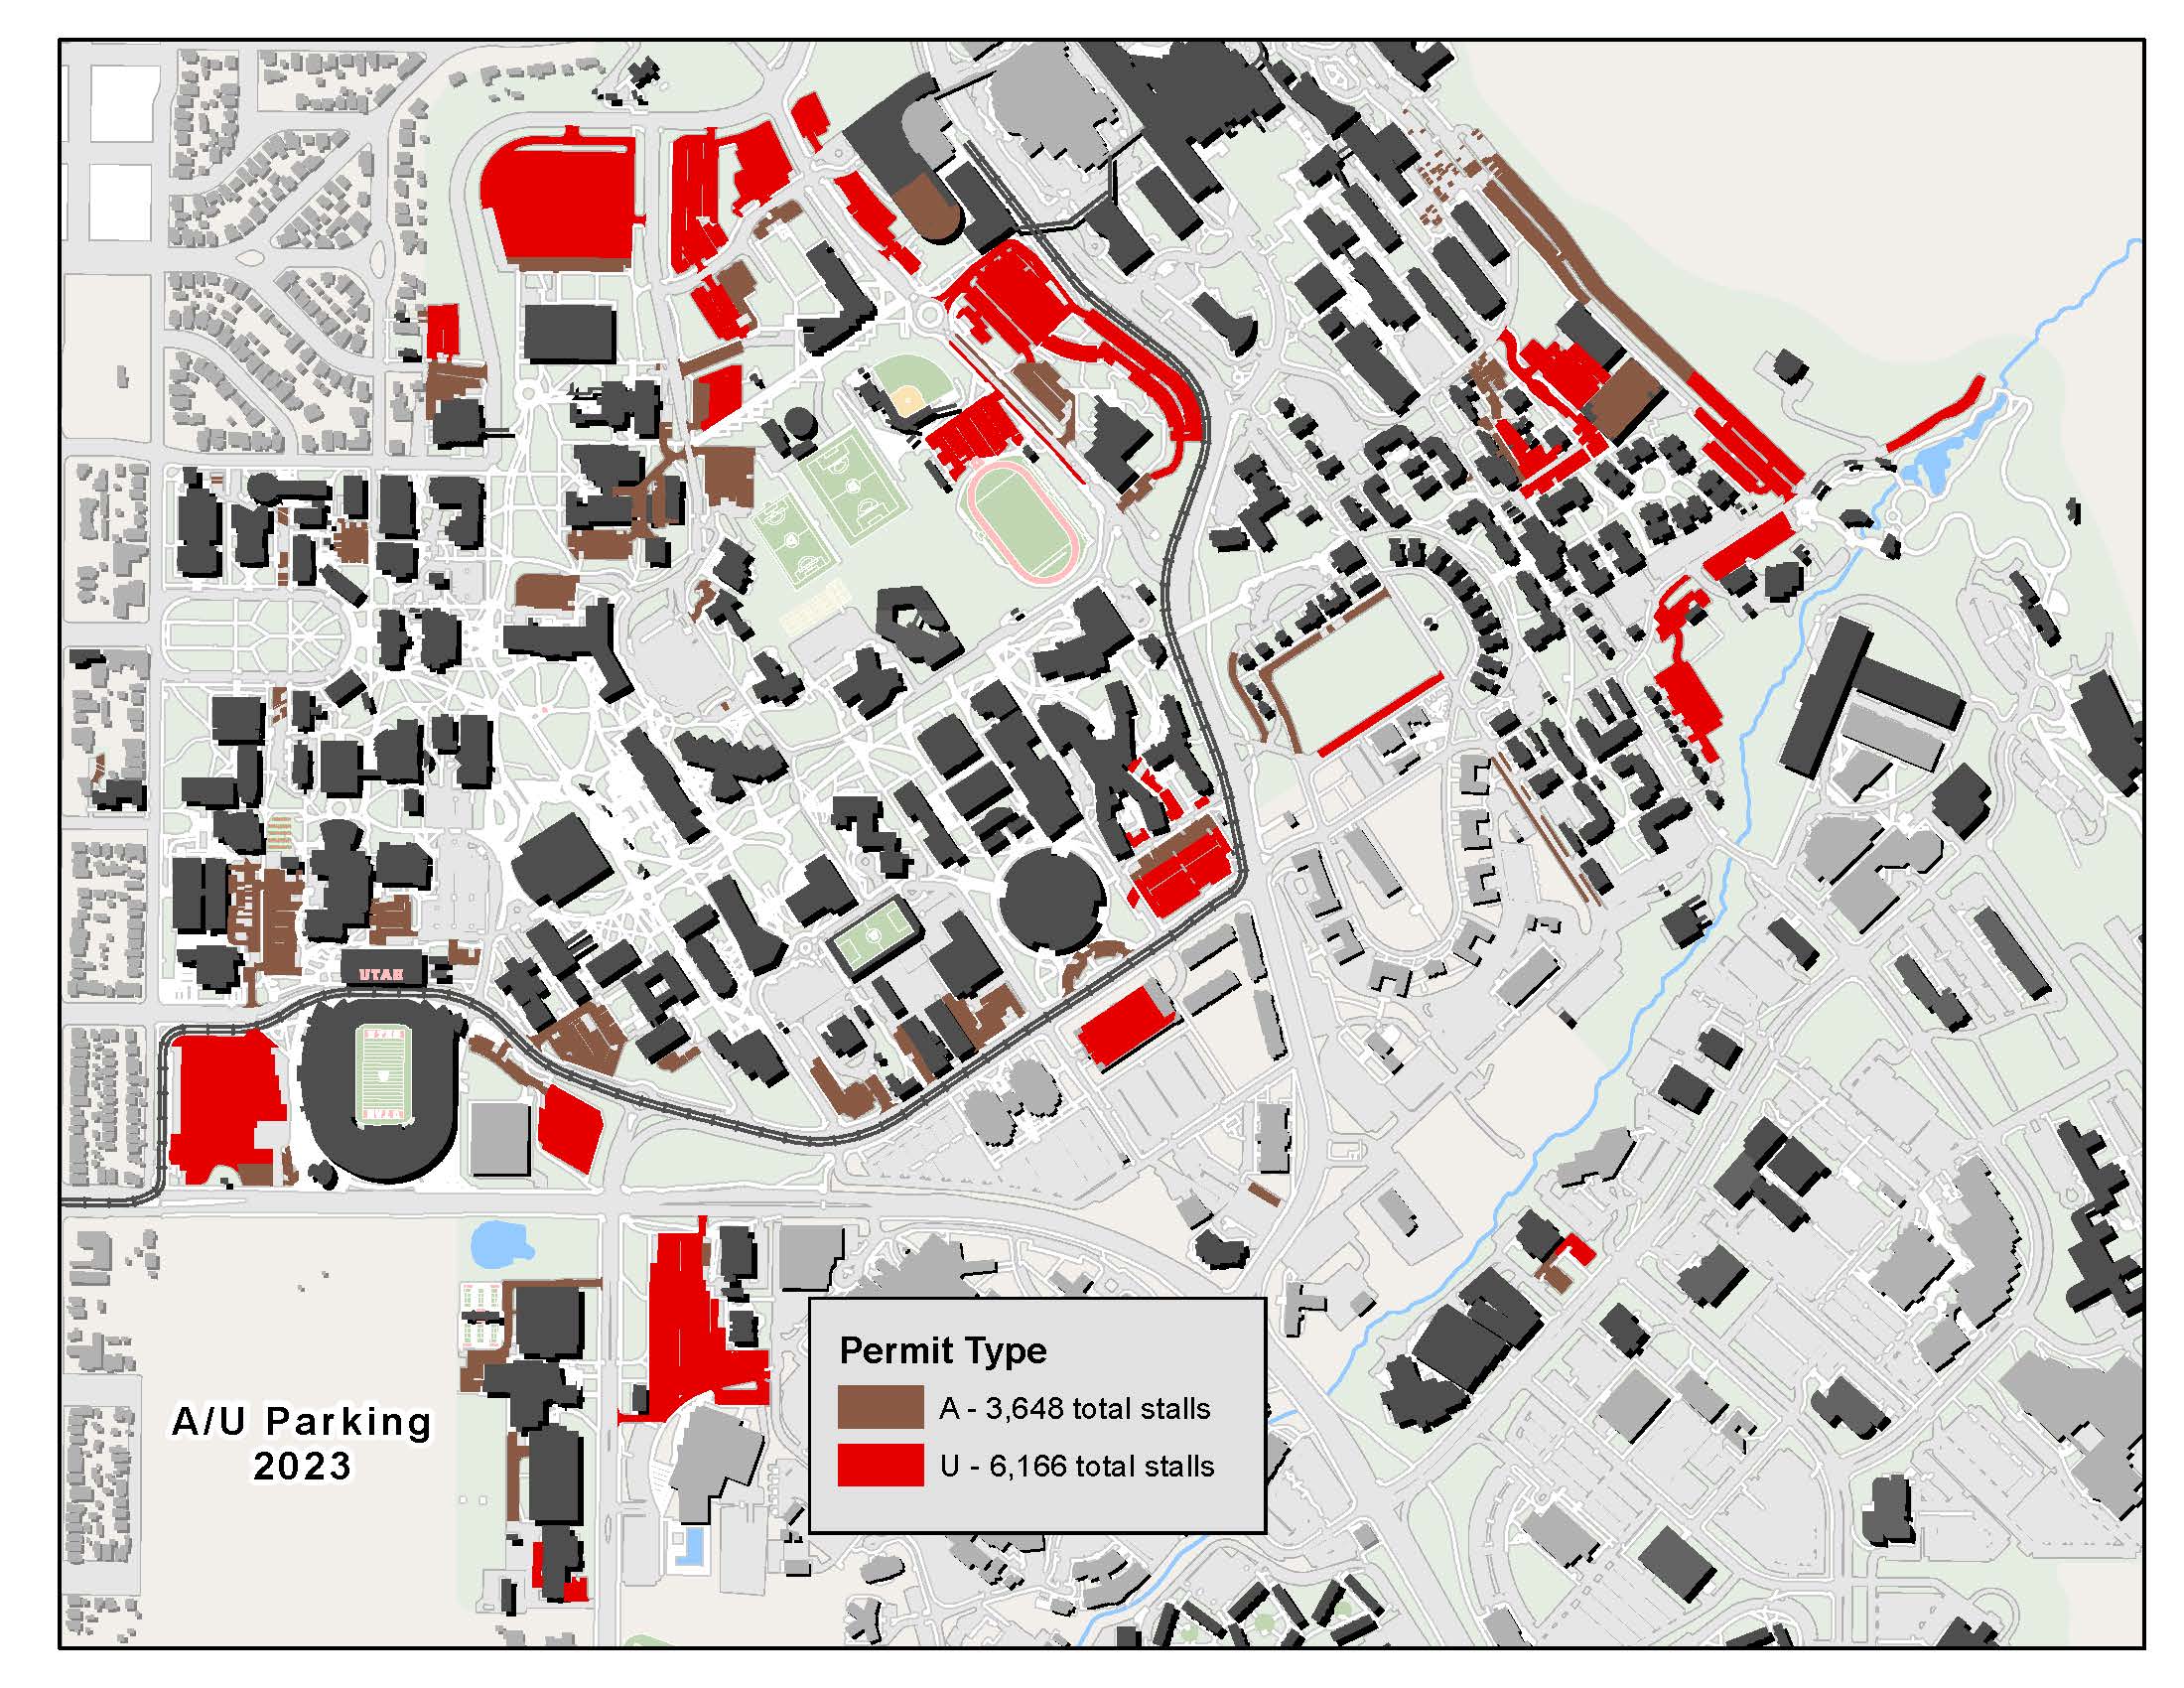


Parking at the University of Utah is dynamic as our campus grows and develops. U parking typically makes up just under 50% of the permit parking on campus, though during the pandemic we temporarily shifted about 10% of the U parking stalls to A to better accommodate the essential staff keeping our campus operating smoothly.
The parking stall distribution at the University of Utah is occasionally adjusted to meet the needs and demands of our commuters, but the parking maps are kept up to date with any changes to stall type made.
Permits
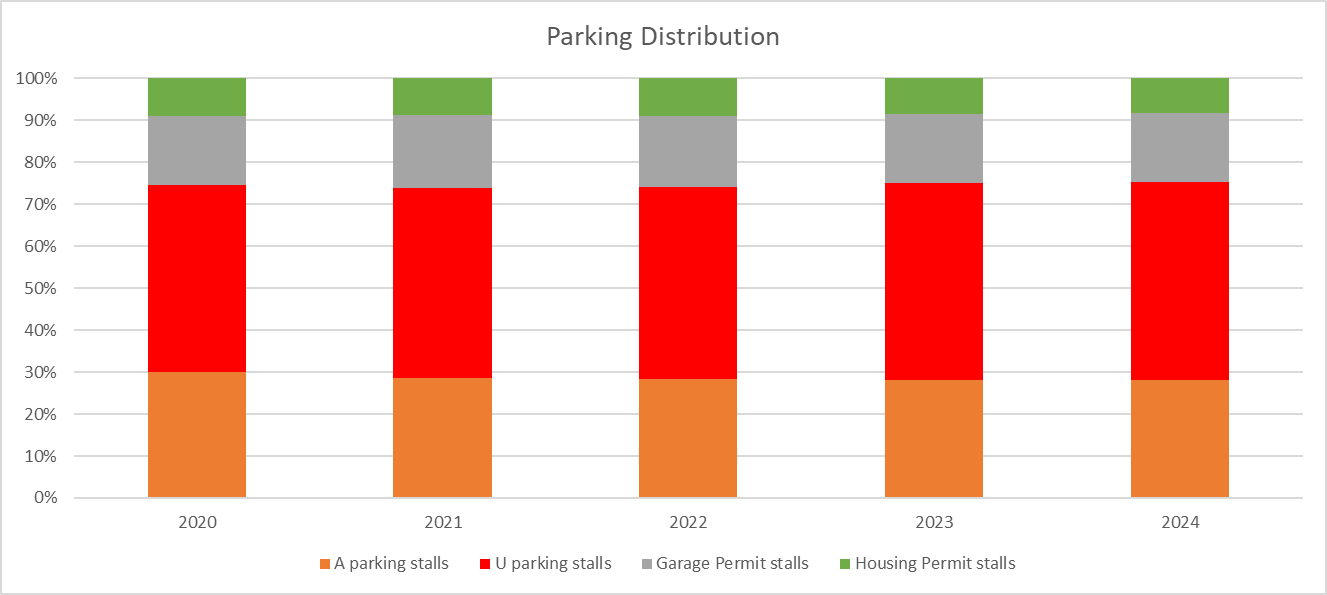
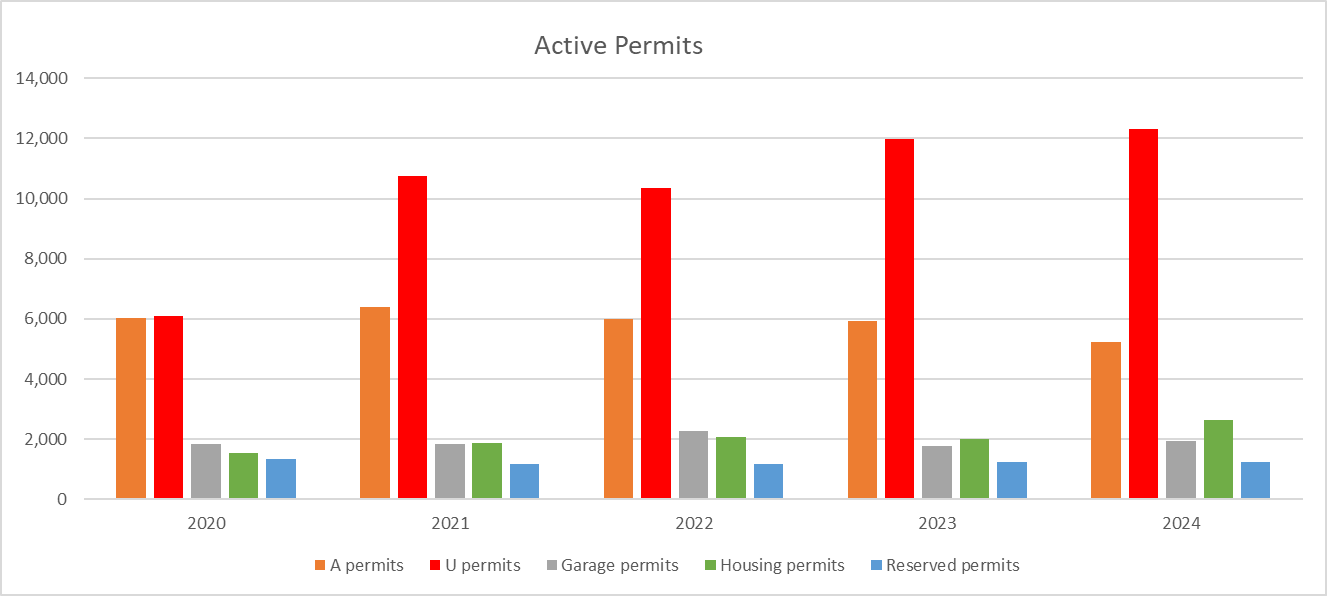
The number of active parking permits follows a similar ratio to that of our parking. The U permit provides access to the largest number of parking spaces throughout campus, rendering it a highly attractive choice for students, staff, and faculty members alike. The historical popularity of U permits across our campus community is evident through the figures below. When compared to the permit types available, including A permits, garage permits, housing permits, and reserved permits, it is clear that the U permit’s value cannot be beat.
Capacity vs. Availability
The data below shows that despite the number of parking stalls being outnumbered by the active permits, parking remains available. This is due to the transient nature of parking on campus. Many students, staff, faculty, and visitors are not on campus for the entire day, creating an ongoing turnover of parking across campus. Parking availability reaches its lowest in the morning, and becomes available after 2pm.


Both the amount of parking and permits have seen significant changes during this span as campus becomes more dense and enjoys a larger population. As growth continues, we will continue to see changes and new trends.


Commute Data
Modal Split
The University of Utah has pledged to provide its graduates knowledge, research, and practice to create a positive and sustainable future. This includes working toward carbon neutrality and building resilience to climate impacts. The driving force of progress toward meeting the goals of our climate commitments is the Climate Action Plan. Transportation makes up approximately 30% of the University’s emissions. Data gathered in the Commuter Survey is used to determine how our campus population commutes, and this data is divided into categories of travel called mode split. The survey is also used to identify transportation hurdles and programs that can improve commuting to campus.

The mode split shown above shows that our campus community has primarily relied on single occupant vehicles (SOV). Notably, the COVID-19 pandemic prompted a surge in telecommuting, reaching unprecedented levels of 74% each year. Subsequently, as the impact of COVID-19 diminished and a return to in-person classes was mandated by the State, commuting behaviors in the ensuing years reverted to previously observed trends, albeit with an additional 18% adoption of telecommuting.
Transit
Commuter Services is proud to collaborate with the Utah Transit Authority (UTA). Our campus has a transit service level that is rare in higher education institutions. Prior to the onset of the COVID-19 pandemic, the ridership on UTA services was second only to SOVs, accounting for 40% of our commute mode with nearly 200,000 trips per month. UTA ridership experienced a decline during the pandemic, but has embarked on a path of recovery. Increasing transit ridership is one of the primary strategies outlined in Commuter Service’s long-term strategy, as the most efficient transportation option serving the University community.
Commuter Reports
Plans & Resources
Resources
Transportation impacts everyone, and Commuter Services is continually supporting capstone projects, research, and developing technology that improves our campus transportation and assists the University in meeting our carbon neutral goals. The commuter and transportation data can be requested by researchers and student groups with faculty oversight.
The Parking System and Public Transportation Advisory Committee serves as an advisory group to the administration on the University parking system and public transportation services available on campus, and reviews concerns and interests from any person or group. The committee reports to the Chief Operating Officer. Voting members include one alumnus recommended by the Alumni Association, three faculty members recommended by the Personnel and Elections Committee, four students recommended by ASUU, and one staff member, all to be approved by the President. More information and a current committee roster can be found here.
Plans
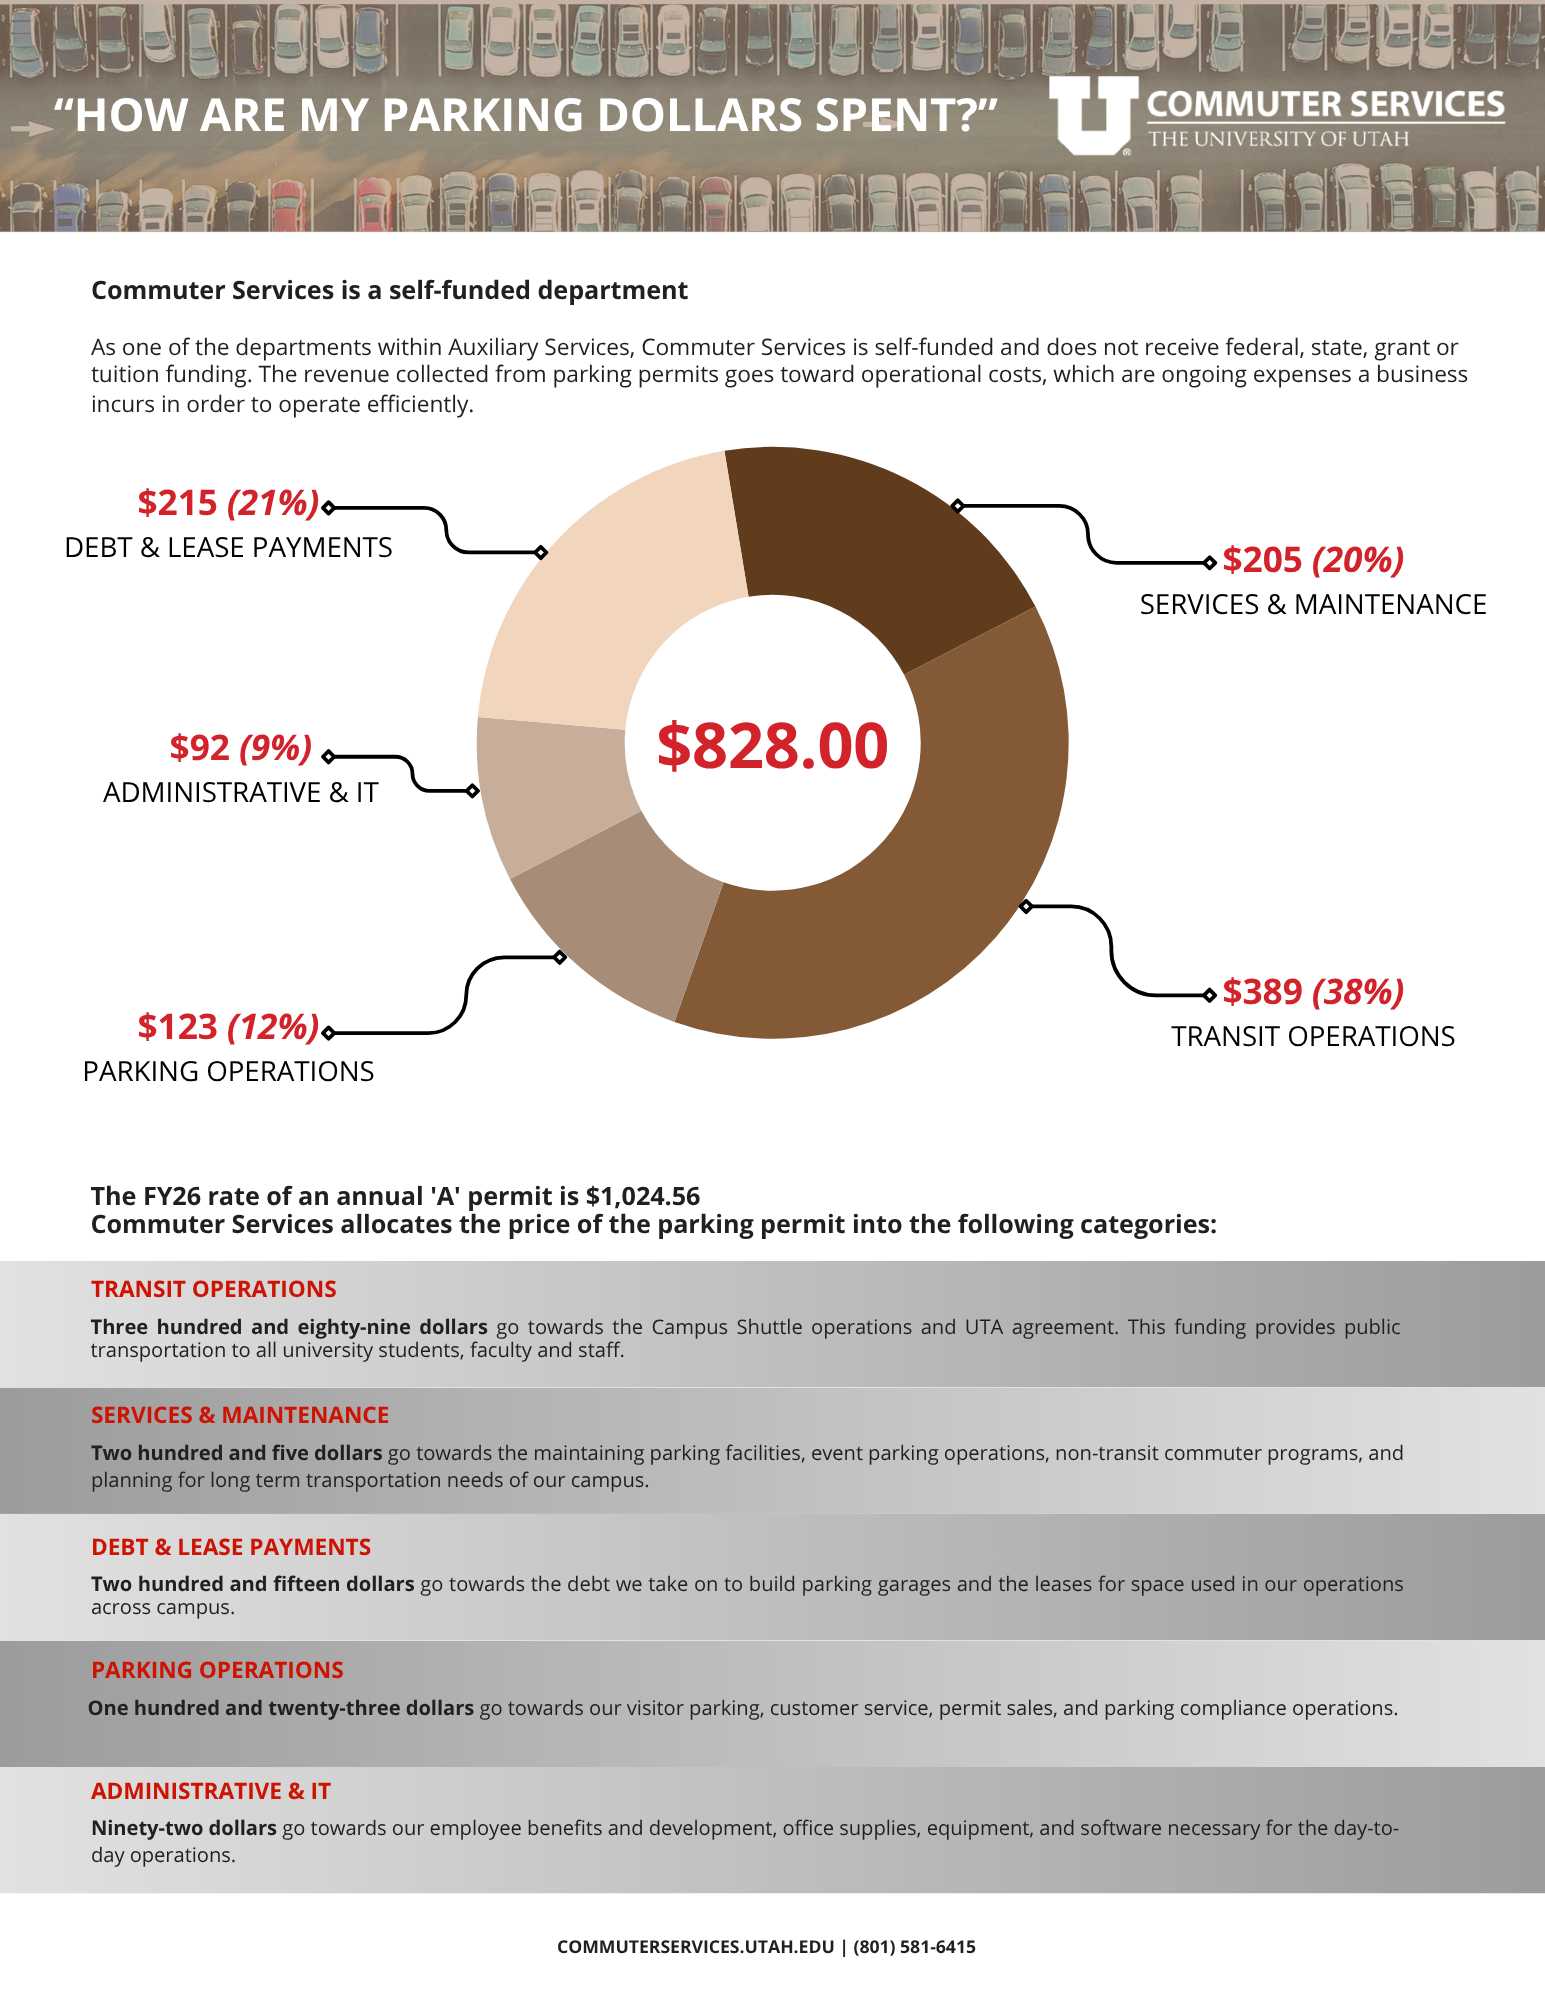
How We Use Parking Dollars
Commuter Services operates as an auxiliary department, which requires us to maintain financial self-sufficiency without the support of state or tuition dollars. The revenue generated from parking permits, visitor parking, compliance, and special event parking management supports ongoing operational costs essential to our transportation and parking infrastructure, associated programs/initiatives, and other auxiliary functions at the institution. We are committed to providing excellent customer service to the University community.
For more information on how revenue from parking permits is used, please view the below infographics. PDF versions are also available for download.